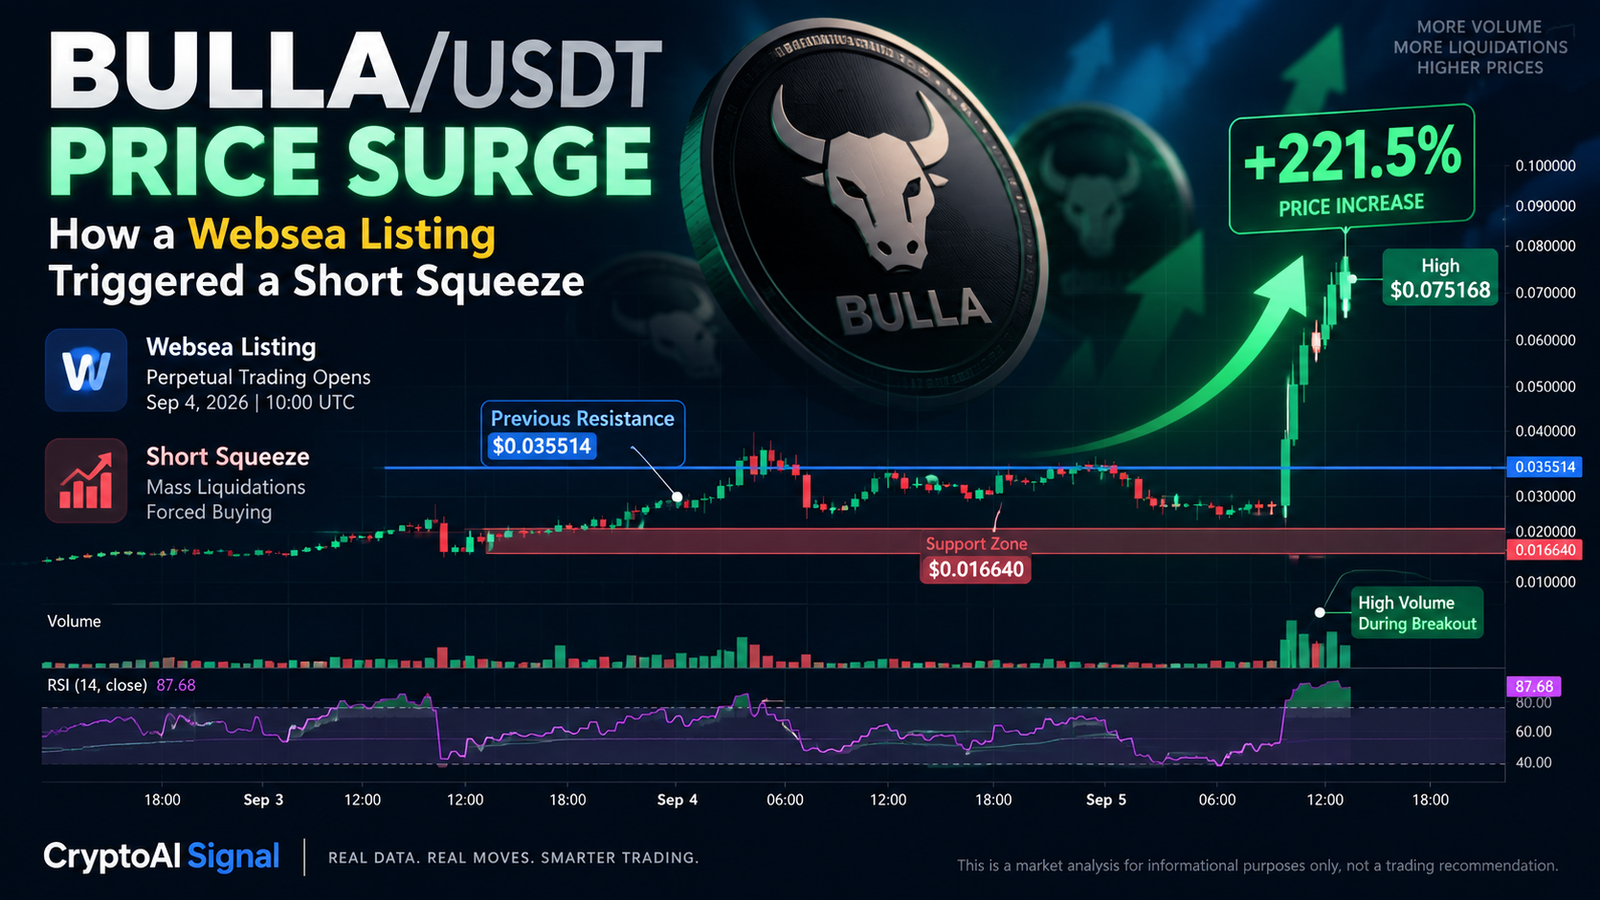
What Happened to BULLA/USDT
BULLA/USDT has just gone through one of the sharpest moves in its short trading history. After months of a flat-to-falling price, BULLA broke out on September 3, 2026, and kept climbing over the next two days, at one point trading more than 200% above its pre-breakout level before pulling back hard.
The rally was not driven by a new product, a partnership, or any change to what BULLA actually is. It came from two things stacking on top of each other: a fresh exchange listing that pulled traders back to the token, and a short squeeze that forced a wave of leveraged sellers to buy back their positions.
This article breaks down what triggered the move, how the squeeze worked, what the chart shows, and what risks are still attached to BULLA as a token. It is a news and market-behavior report, not a trade recommendation.
The Catalyst: Websea Opens BULLA Perpetual Trading
The trigger traces back to an official announcement from Websea, a crypto derivatives exchange. Websea posted on its X account that BULLA perpetual futures trading would open on September 4, 2026, at 10:00 UTC, with both long and short positions supported and flexible leverage available.
The important detail is timing. The announcement landed about a day before the sharpest part of the rally, and BULLA started moving on September 3. Before that, the token had spent months drifting sideways to down, capped under a resistance zone near $0.020436 that had held since April 2026. A new derivatives venue gave traders a fresh reason to look at a token most of the market had been ignoring.
One thing to be clear about: this was not BULLA's first appearance on futures markets. The token already traded as a perpetual contract on larger venues, including Binance. So Websea was an additional listing that renewed attention and volume, not the debut of BULLA derivatives. That distinction matters, because most of the liquidation pressure that followed actually played out on Binance, the deeper venue, even though the Websea announcement was the spark.
New perpetual listings tend to have this effect on smaller tokens. They add trading venues, new leverage options, and renewed visibility on social media, all of which can pull in speculative volume very quickly.
Market Behavior: A Short Squeeze Did Most of the Work
A listing announcement alone rarely explains a move of this size. What made the BULLA rally explosive was a short squeeze layered on top of it.
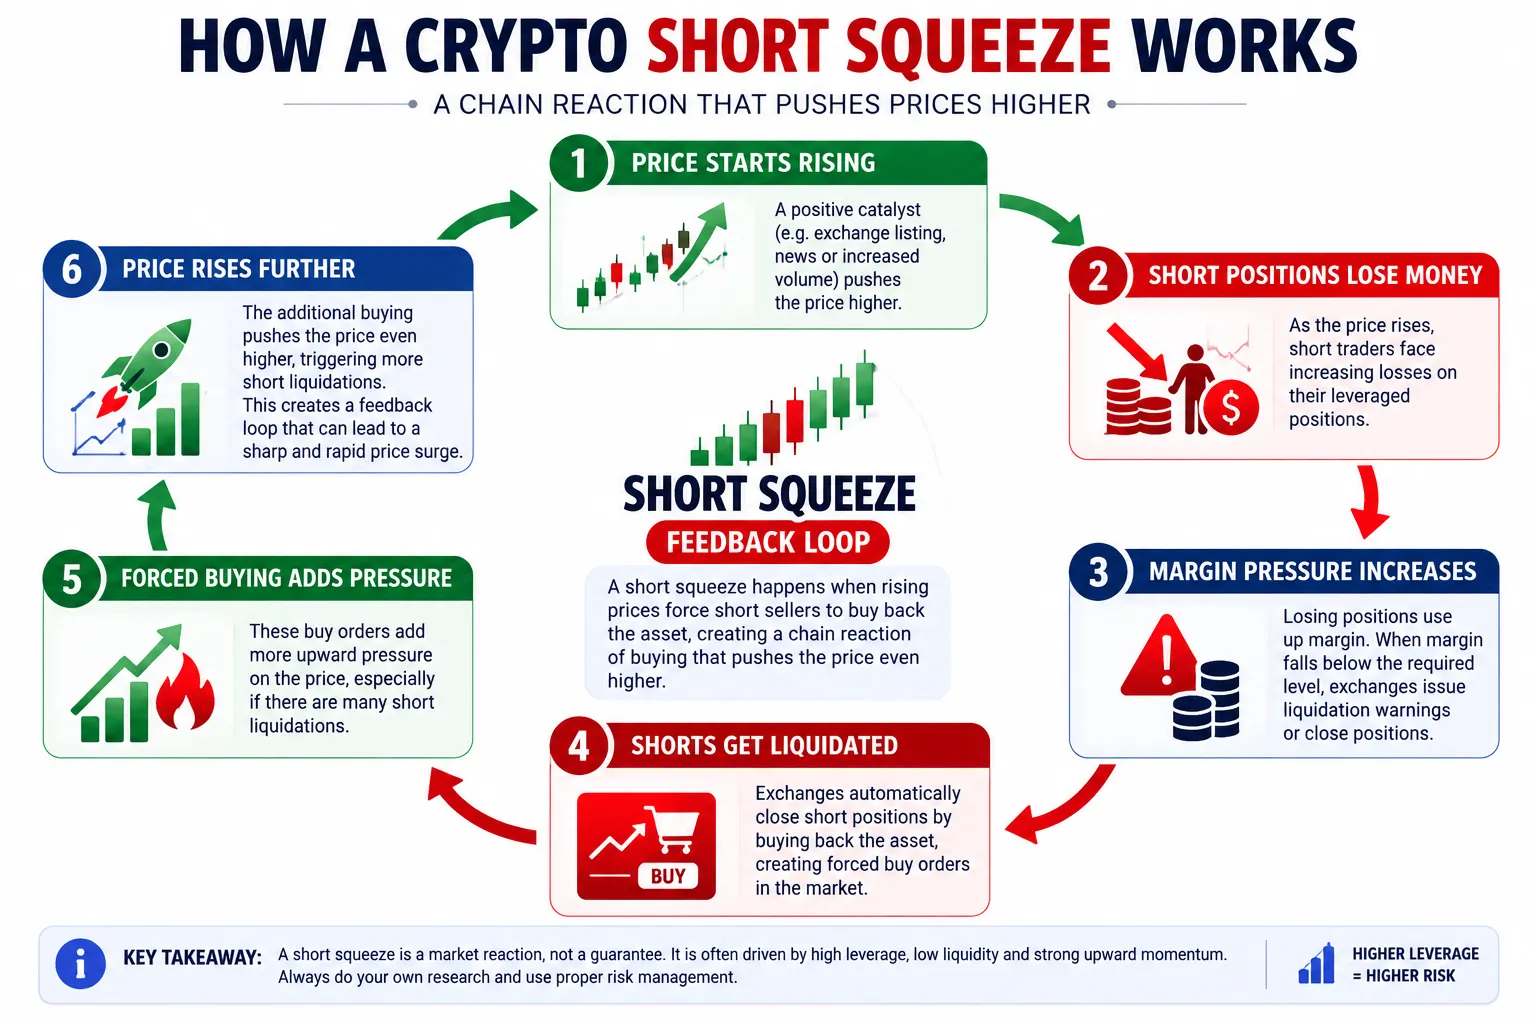
Before the breakout, a meaningful share of open positions in BULLA were short bets, traders wagering that the price would fall. Once the price started rising instead, those short positions began losing money. On leveraged futures, a losing position that runs out of margin gets force-closed, or liquidated. Each forced liquidation of a short position works like a forced buy order, because the exchange has to close the position by buying back the asset. That buying adds more upward pressure, which triggers more short liquidations. This chain reaction is what traders call a short squeeze.
The liquidation data makes the imbalance clear. Around the early breakout on September 3, 2026 (based on CoinMarketCap figures referenced by market analysts), total liquidations over 24 hours came to roughly $511,000, split into about $412,000 in shorts and only around $100,000 in longs. Over a 12-hour window the pattern was the same: close to $320,000 in short liquidations against about $89,000 in longs. In other words, traders betting against BULLA were the ones getting wiped out.
As the rally extended into the following days, the imbalance grew. Liquidation data reported through Coinglass and cited by market trackers showed short liquidations near $1.39 million over 24 hours, compared with about $177,000 in long liquidations. During this stretch, Binance's account-based long/short ratio sat below 1 (around 0.8751), meaning more individual accounts were positioned short, while the "top trader" ratio leaned slightly long. Open interest in BULLA futures climbed to a new high near $37 million before falling back toward the mid-$20 million range, a sign that leveraged positioning, not steady spot buying, was central to the move.
Put simply: a large part of this rally was traders being forced out of short positions, not a wave of fresh conviction buying.
Price Structure: What the Chart Shows
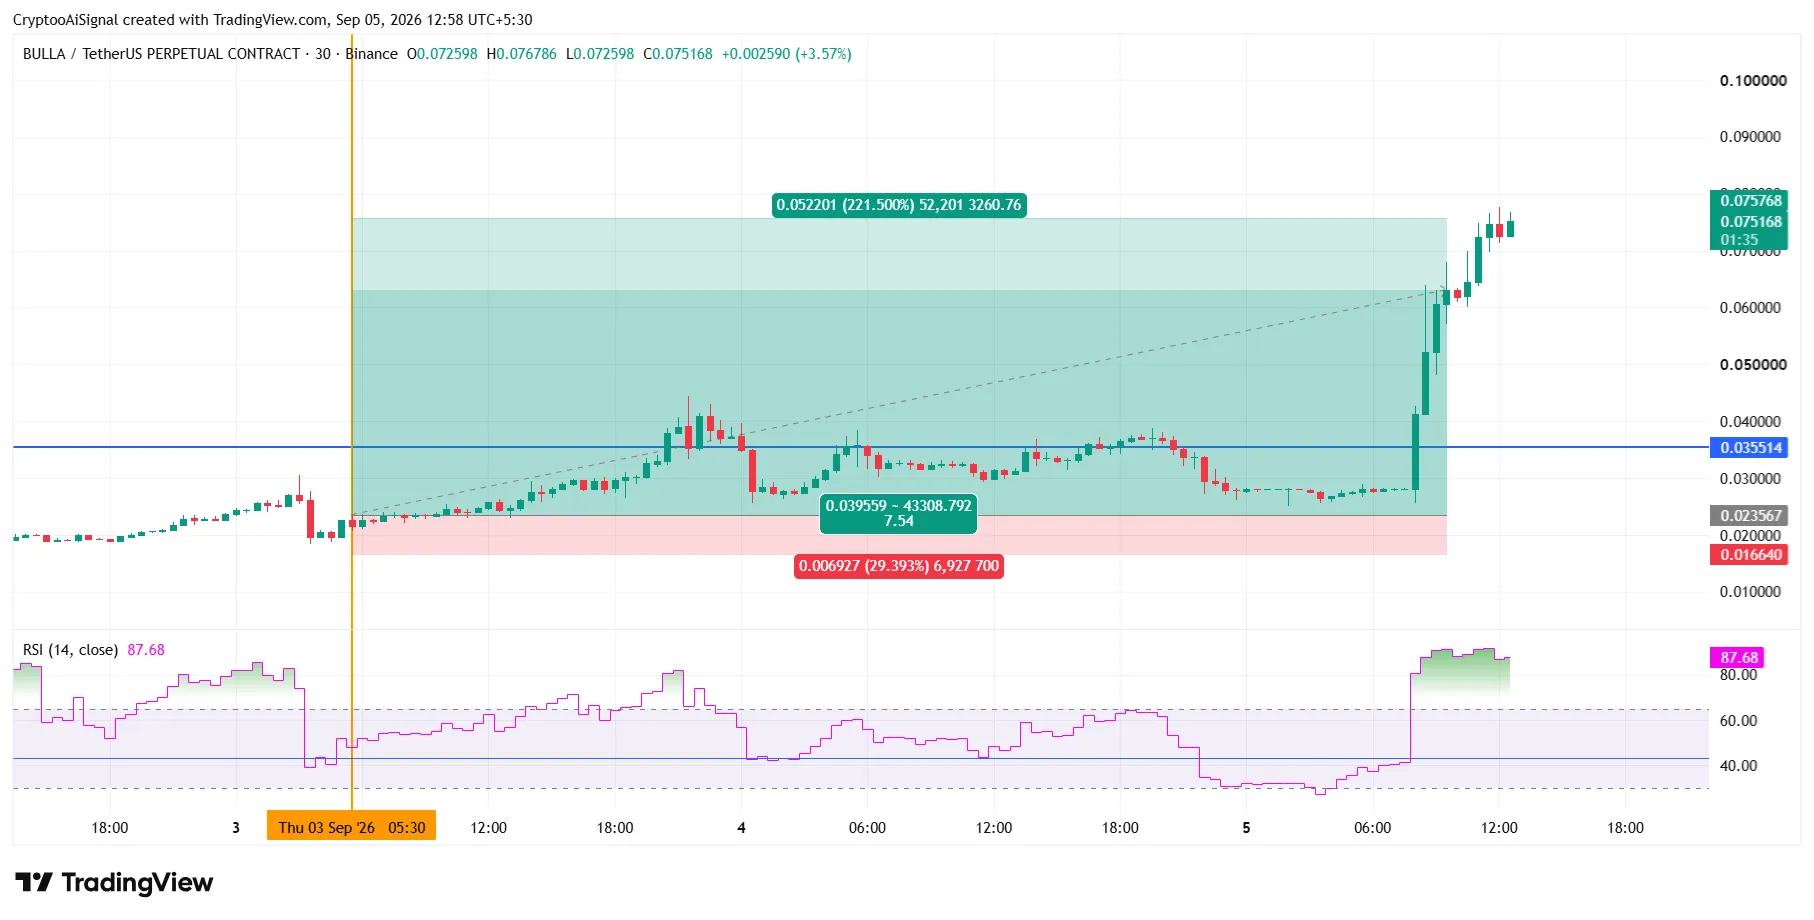
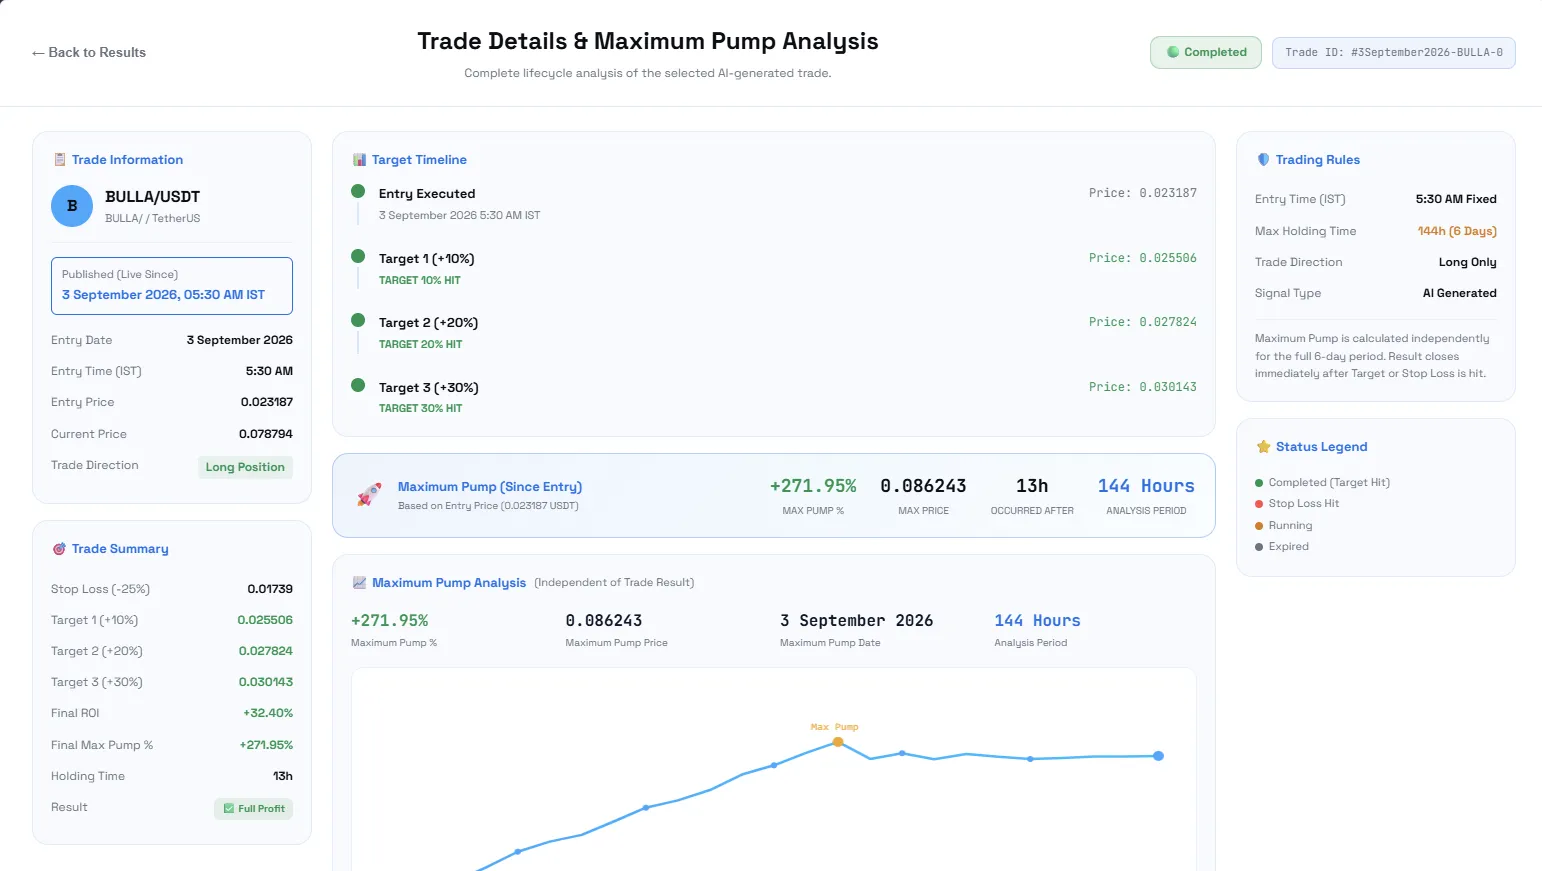
The BULLA/USDT chart around this period shows a clean technical pattern. Price had been range-bound below the $0.020 resistance zone for months. Once it broke above that level on September 3, the move accelerated instead of fading, and by September 5 it had extended into the $0.07–$0.08 area, a gain of more than 220% from the level marked at the start of the breakout window.
The path up ran through several resistance levels that traders had flagged, including roughly $0.0301, $0.0401, $0.0504, and $0.0700, with the token clearing them in a fast, multi-stage climb rather than a single leg. Short-term moving averages that had been sitting well below price during the breakout began acting as support once the move was underway.
The Relative Strength Index (RSI), a momentum indicator that measures how far and how fast price has moved, pushed deep into overbought territory during this stretch, printing readings near 88. An RSI this high does not predict an exact top, but it does signal that a move has run far and fast, which historically raises the odds of a sharp pullback or at least a cooling-off period before any further advance.
TRADING VIEW CHART
CryptoAI Signal Top 3 Elite Premium Signal Result
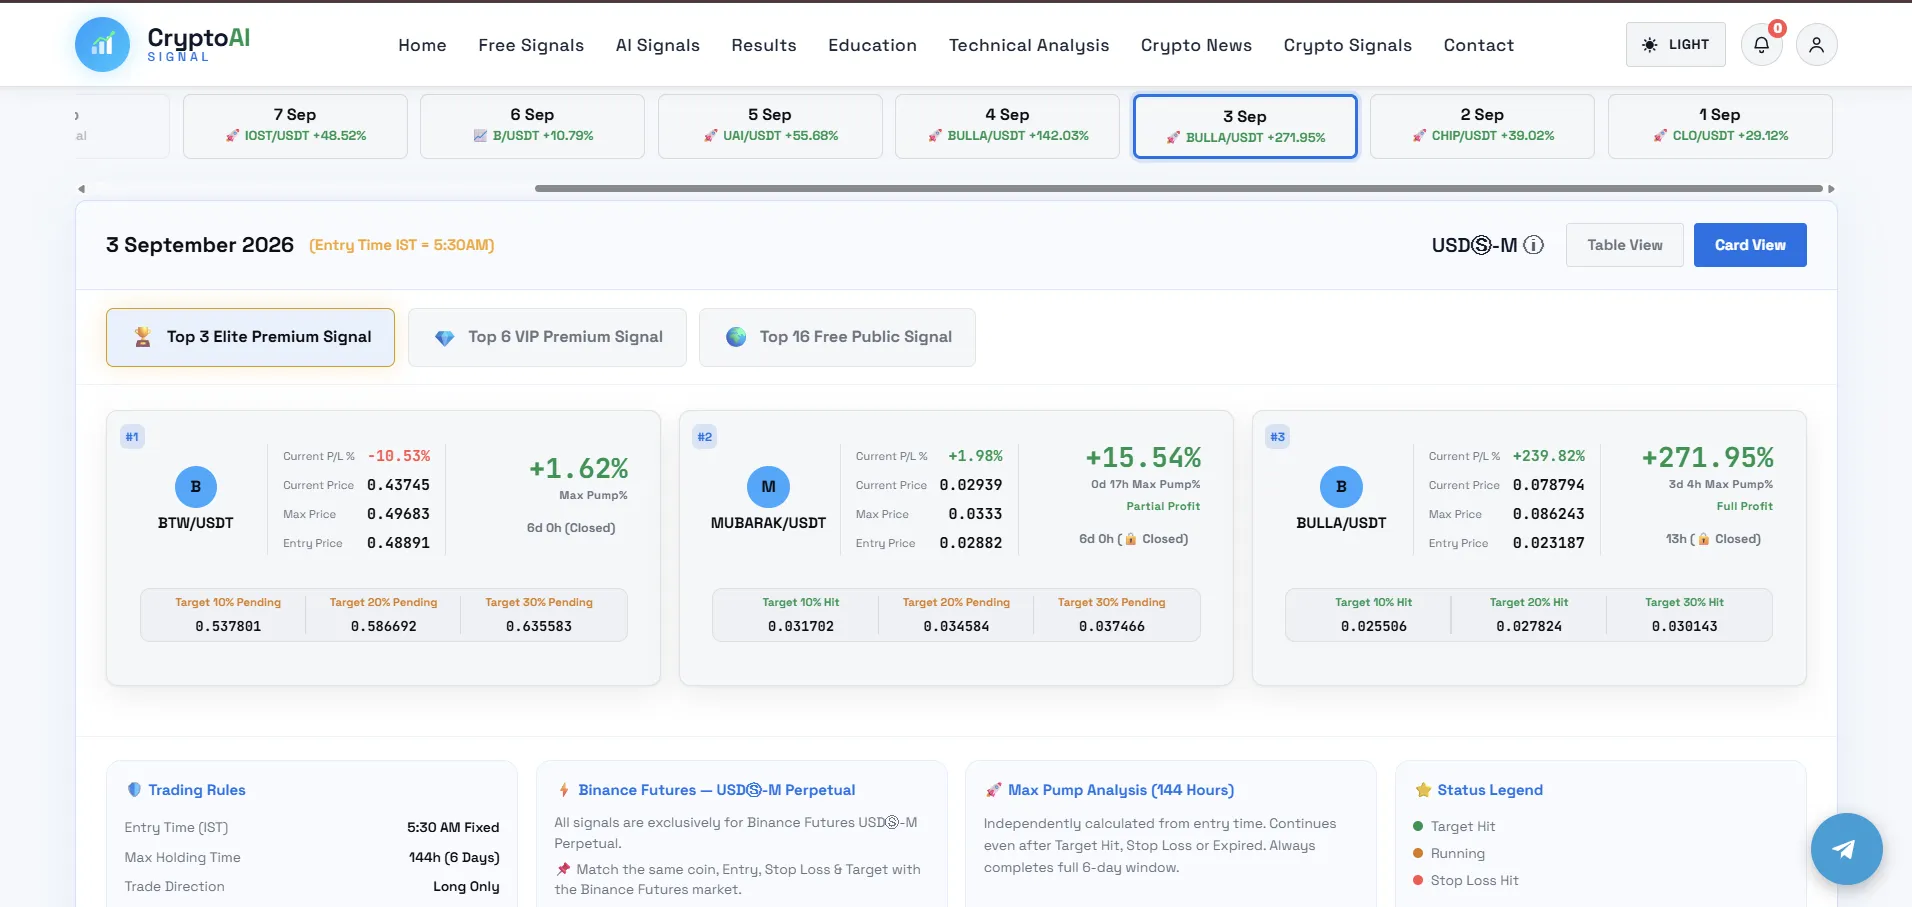
Trade Details & Maximum Pump Analysis
The Pullback: Why the Move Cooled
A squeeze-driven rally has a built-in weakness. Once the shorts that were fueling the forced buying are mostly gone, the buying pressure they created disappears with them. If real, sustained demand does not step in to replace it, price tends to fade.
That appears to be what happened here. After peaking, BULLA reversed sharply. Analyst commentary tracking the token described a heavy drop from the roughly $0.06–$0.07 area, with price then trying to stabilize around a lower $0.043–$0.046 zone. The exact figures vary by source and by the moment they were checked, but the direction is consistent: a fast run-up followed by a fast give-back. This is the two-way volatility that squeeze-driven moves in low-liquidity tokens tend to produce.
Context and Risk: What to Know Before Reading Too Much Into the Pump
A few points matter for anyone trying to make sense of this move rather than just react to the headline number.
BULLA has no stated product or utility. It trades on the BNB Smart Chain and is described on its own on-chain profile as a meme token tied to internet personality Hasbulla, with an explicit "no roadmap, no promises" framing. Its value comes from attention, community activity, and trader positioning, not from any underlying product, revenue, or use case. That is not a hidden flaw here; it is the token's entire premise.
Supply is extremely concentrated. On-chain holder data from BscScan (as reported by market trackers) shows the top 100 wallets controlling around 98.90% of circulating supply, and just four wallets, classified as whales, holding roughly 86.68% of the market cap despite making up under 0.01% of all holders. The token's Gini distribution score sits near 0.9998, with about 19 wallets each holding at least 1% of supply. When a handful of wallets control almost everything, a single large holder deciding to sell can move the price sharply. Concentration like this is common in small-cap tokens, but it materially raises volatility risk.
This is not the first squeeze-driven spike for BULLA. An earlier rally on April 19, 2026, was also attributed to a short squeeze, one severe enough that open interest in BULLA futures reportedly exceeded the token's entire market capitalization at the time, according to analysis reported by exchange WEEX. That earlier move also gave back its gains once the squeeze ran its course, which is exactly the pattern that repeated here.
Analysts described the move as mechanical, not fundamentals-driven. Commentary from the CoinGabbar analyst desk framed the rally as built mainly on a listing catalyst and heavy short liquidation, the kind of setup that typically brings sharp two-way volatility rather than a smooth, sustained trend once the forced buying fades.
Data providers disagree on exact live figures. Different trackers (CoinMarketCap, CoinGecko, Coinglass, and individual exchange pages) can show BULLA at slightly different prices and percentage changes at the same moment, because each aggregates a different mix of markets and timeframes. Readers comparing numbers across sites should expect small mismatches rather than treat any single figure as definitive.
None of this means the move was fake. It means the rally's engine was positioning and leverage dynamics as much as demand for the token itself, and tokens that move this way have a history of falling as fast as they rise.
Where BULLA Stands Now
BULLA remains far more volatile than a typical asset, and its price depends heavily on which snapshot and which tracker you look at. After the peak near the $0.07–$0.08 area, it pulled back into a lower range as the squeeze faded. Even at its rally highs, it stayed well below its all-time high near $0.55 from February 2026, though it was also many times above the sub-$0.01 lows it traded at earlier in the year, before the Websea news.
Trading volume has stayed elevated compared with the quiet months before the breakout, which shows continued active interest. But high volume on a small-cap meme token can reflect fast in-and-out trading as much as genuine accumulation. Given BULLA's history of sharp reversals after squeeze-driven rallies, the current situation is best read as ongoing and unsettled rather than a stable new price level.
Frequently Asked Questions
Why did BULLA/USDT pump?
The move was driven by two things together: a Websea announcement opening BULLA perpetual trading on September 4, 2026, which renewed trader attention, and a short squeeze that forced leveraged short sellers to buy back their positions. The forced buying pushed the price up faster than normal demand alone would have.
What is a short squeeze in crypto?
A short squeeze happens when many traders are betting a price will fall (they are "short"), but the price rises instead. Their losing positions get force-closed, and closing a short means buying back the asset. That buying pushes the price even higher, which forces out more shorts, creating a fast upward spiral.
Does BULLA have any real utility?
No. BULLA is a meme token on the BNB Smart Chain with no stated product, roadmap, or use case. Its price is driven by attention, social activity, and trader positioning rather than fundamentals.
Why do different websites show different BULLA prices?
Each tracking site aggregates a different set of exchanges and timeframes, so live price and 24-hour change figures can differ slightly at the same moment. This is normal for low-liquidity tokens and is why it helps to check more than one source.
Conclusion
The BULLA/USDT rally is a clear example of two forces combining: a fresh Websea perpetual listing that renewed trader attention, and a short squeeze that forced leveraged shorts out of their positions, adding mechanical buying on top of the initial spark. The chart supports this, with a clean breakout above long-held resistance and a deeply overbought RSI during the sharpest part of the move, followed by a fast pullback once the squeeze cooled.
What the move does not include is any new product, partnership, or change to BULLA's fundamentals, because the token remains a meme coin with no stated utility and an extremely concentrated holder base. Its April 2026 history shows the same squeeze-and-fade pattern. For anyone following this kind of move, the practical takeaway is simple: understand what actually drove the price before reading a fast pump as lasting strength.
This article is for informational purposes only and is not financial advice. Cryptocurrency markets, and meme tokens in particular, are highly volatile, and past price behavior does not guarantee future results.
Sources
The information in this article is drawn from the following public sources. Live figures on these pages update in real time and may differ slightly from the numbers quoted above, which reflect the dates and snapshots noted in the text.
Websea (official X account) — the exchange's BULLA perpetual listing announcement (September 3–4, 2026): x.com/webseaofficial
Coinglass — BULLA — liquidation data, open interest, and futures volume: coinglass.com/currencies/BULLA
BscScan — BULLA token — on-chain holder distribution and contract details: bscscan.com/token/0x595e21b20e78674f8a64c1566a20b2b316bc3511
CoinMarketCap — BULLA — price, market cap, all-time high and all-time low: coinmarketcap.com/currencies/bulla-mascot
CoinGecko — BULLA — price, trading volume, and market data: coingecko.com/en/coins/bulla-3