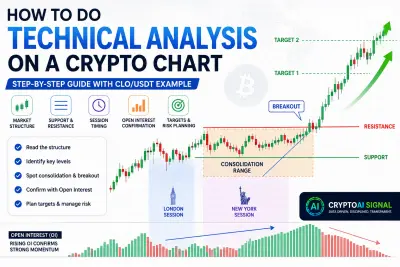
A step-by-step guide to technical analysis on a crypto chart. Using a real CLO/USDT before-and-after example, learn how to read timeframe, market structure, support and resistance, breakouts, open interest, and targets.
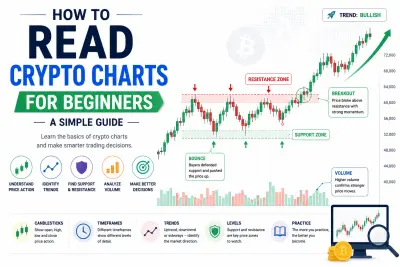
Learn how to read crypto charts step by step. This beginner guide explains candlesticks, timeframes, trend, support and resistance, and volume in simple language so you can understand what a price chart is telling you.
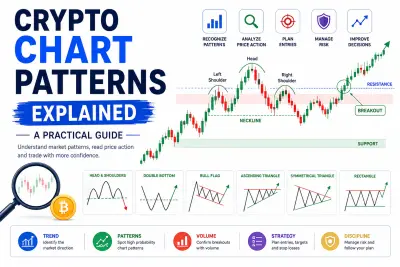
Learn what crypto chart patterns are, how they form, and the main reversal and continuation patterns. Understand how to read them, why they show probability rather than prediction, and how to use them with volume and risk management.