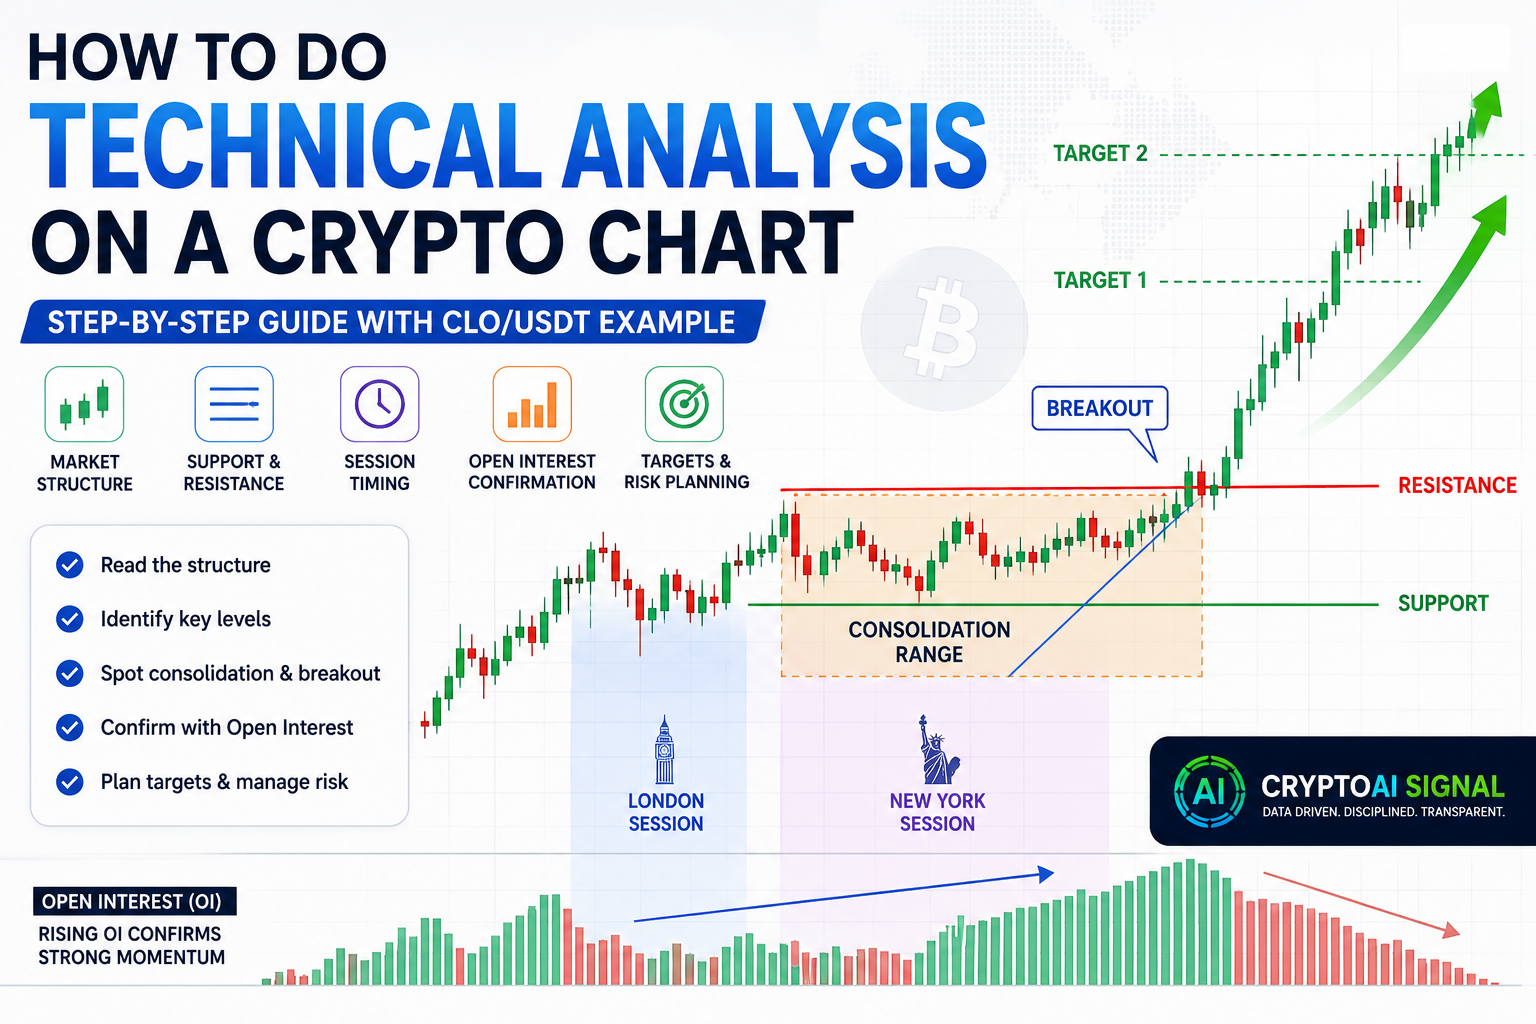
What Is Technical Analysis?
Technical analysis, often called TA, is the study of price and volume on a chart. Instead of looking at news or project details, technical analysis looks at how price has moved and how traders are behaving right now.
The goal is to find patterns and levels that can guide a trade. TA does not predict the future with certainty. It works with probabilities. A good chart read tells you what is more likely, not what is guaranteed.
In this article, we will walk through how technical analysis is done, step by step, using one real chart.
The Chart We Will Analysis
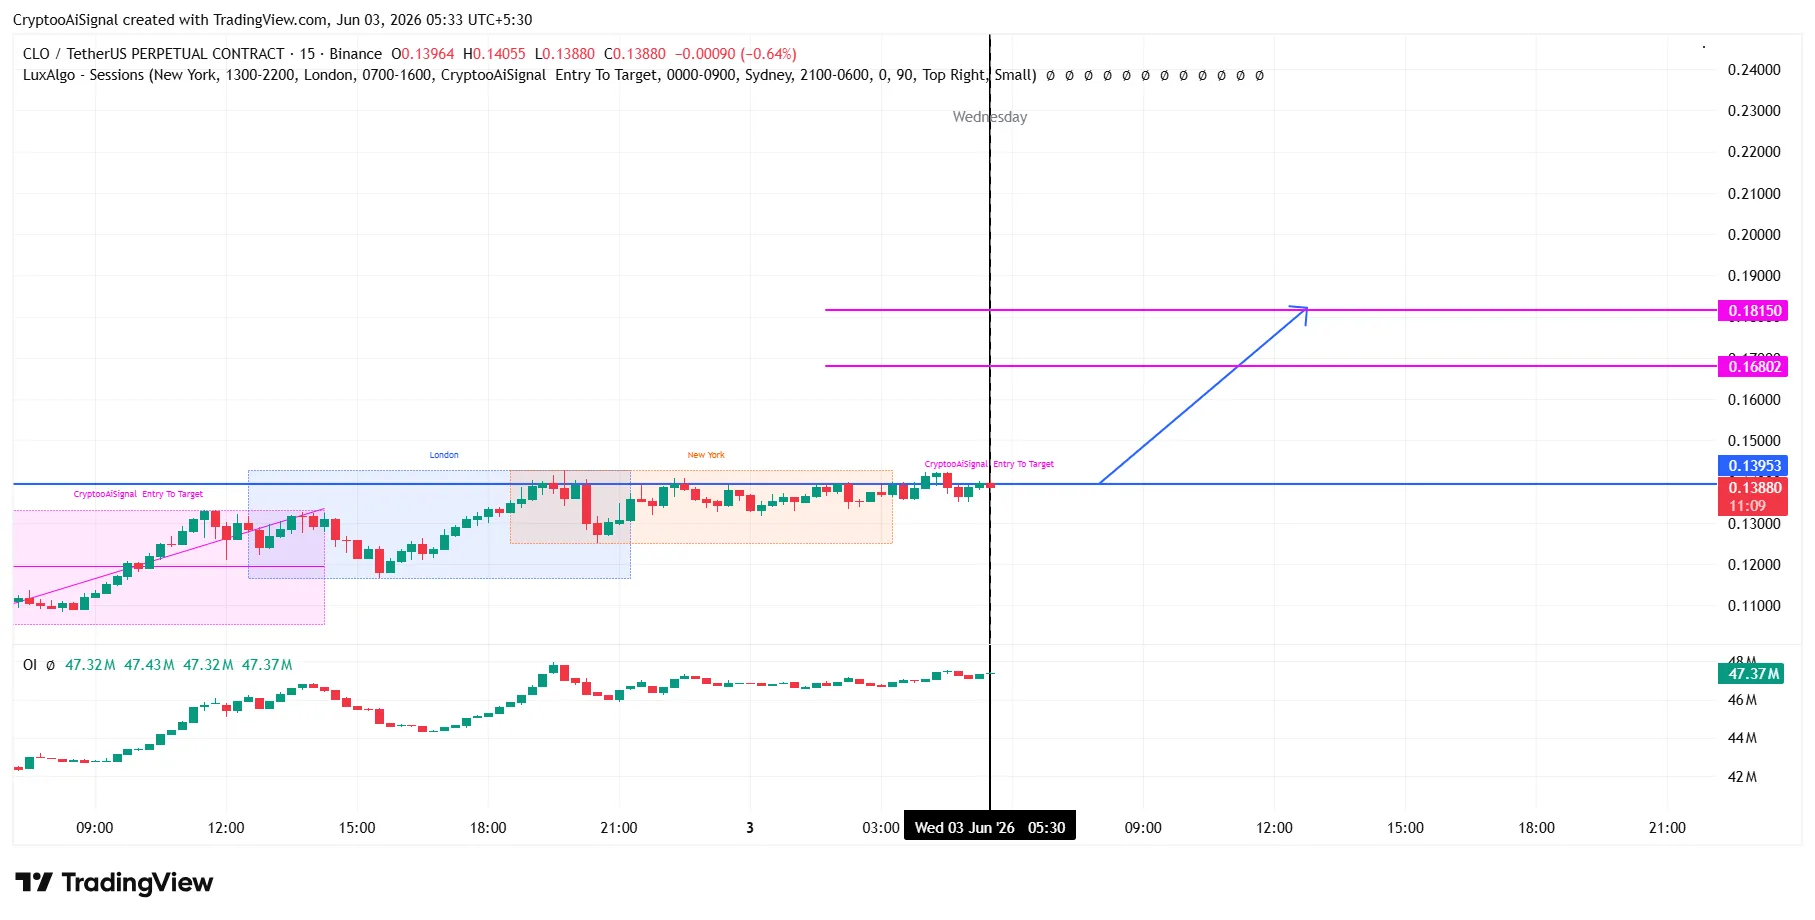
We will use CLO/USDT on Binance Futures, on the 15-minute timeframe. The chart comes from CryptoAI Signal and is shown in two views: one before the trade played out, and one after.
Please note one thing first. This is a single historical example used to teach a method. It is not proof of accuracy, and it does not promise future results. The value here is the process, not the outcome.
Step 1: Choose the Timeframe
Every chart is built from candles. On a 15-minute chart, each candle shows 15 minutes of price movement: the open, high, low, and close.
Shorter timeframes show more detail but also more noise. Longer timeframes show the bigger trend but fewer entries. The 15-minute chart used here is common for intraday trading, where trades last hours rather than days.
Always know your timeframe before you read anything else.
Step 2: Read the Market Structure
Market structure is the shape of price over time. The first question is simple: is price trending or ranging?
On this chart, price first climbed from a lower area up toward 0.135. That rise, with higher lows, is an uptrend. After the rise, price stopped climbing and moved sideways. This tells us the market paused after a move up.
Reading structure first gives you the context for everything else you see on the chart.
Step 3: Find Support, Resistance, and the Range
Support is a level where price tends to stop falling. Resistance is a level where price tends to stop rising.
Here, price moved sideways in a tight range, roughly between 0.128 and 0.135. The top of that range acted as resistance, and the bottom acted as support. These range edges are important, because a break past them often leads to a new move.
The chart marks an entry level at 0.13953, just above the range resistance. That placement is not random. It sits where a breakout to the upside would begin.
Step 4: Use Session Analysis for Timing
Crypto trades 24 hours a day, but not every hour is equal. The chart uses coloured session boxes for the London and New York trading sessions.
These sessions usually bring more volume and larger price swings. Knowing when the busy hours happen helps you understand when a breakout is more likely to have real strength behind it, and when quiet hours may produce weak, choppy moves.
Step 5: Spot the Consolidation and Breakout
The tight sideways range is called consolidation. During consolidation, buyers and sellers are close to balance, and pressure builds. Traders watch it closely because a strong move often follows.
A breakout happens when price finally pushes out of the range with force. A break above resistance can start a new upward move. This is one of the most common and useful patterns in technical analysis, and it is the core idea behind this setup.
Step 6: Confirm the Trend with Open Interest
Open interest, or OI, is the total number of open futures contracts in the market. It helps confirm whether a move has real strength.
Before the move, OI sat around 47 million. As price rallied, OI rose into the 60 million range. Rising open interest with rising price often means new buyers are opening positions. That adds fuel to a trend.
Later, on the pullback, OI fell again. Falling OI during a drop can mean positions are closing. OI does not predict price by itself, but it is a strong confirmation tool when read together with price.
Step 7: Set and Read Target Levels
Targets are the price levels where a trader plans to take profit. On this chart, two targets are marked: 0.16802 and 0.18150. They sit about +20% and +30% above the entry.
Targets can be set in several ways: from earlier price structure, from measured moves, or as staged percentage levels. Staged targets let a trader take profit in steps instead of guessing one exit point.
A target is a plan, not a promise. Price may reach it, pass it, or never get there.
What Happened After: Breakout, Peak, and Retracement
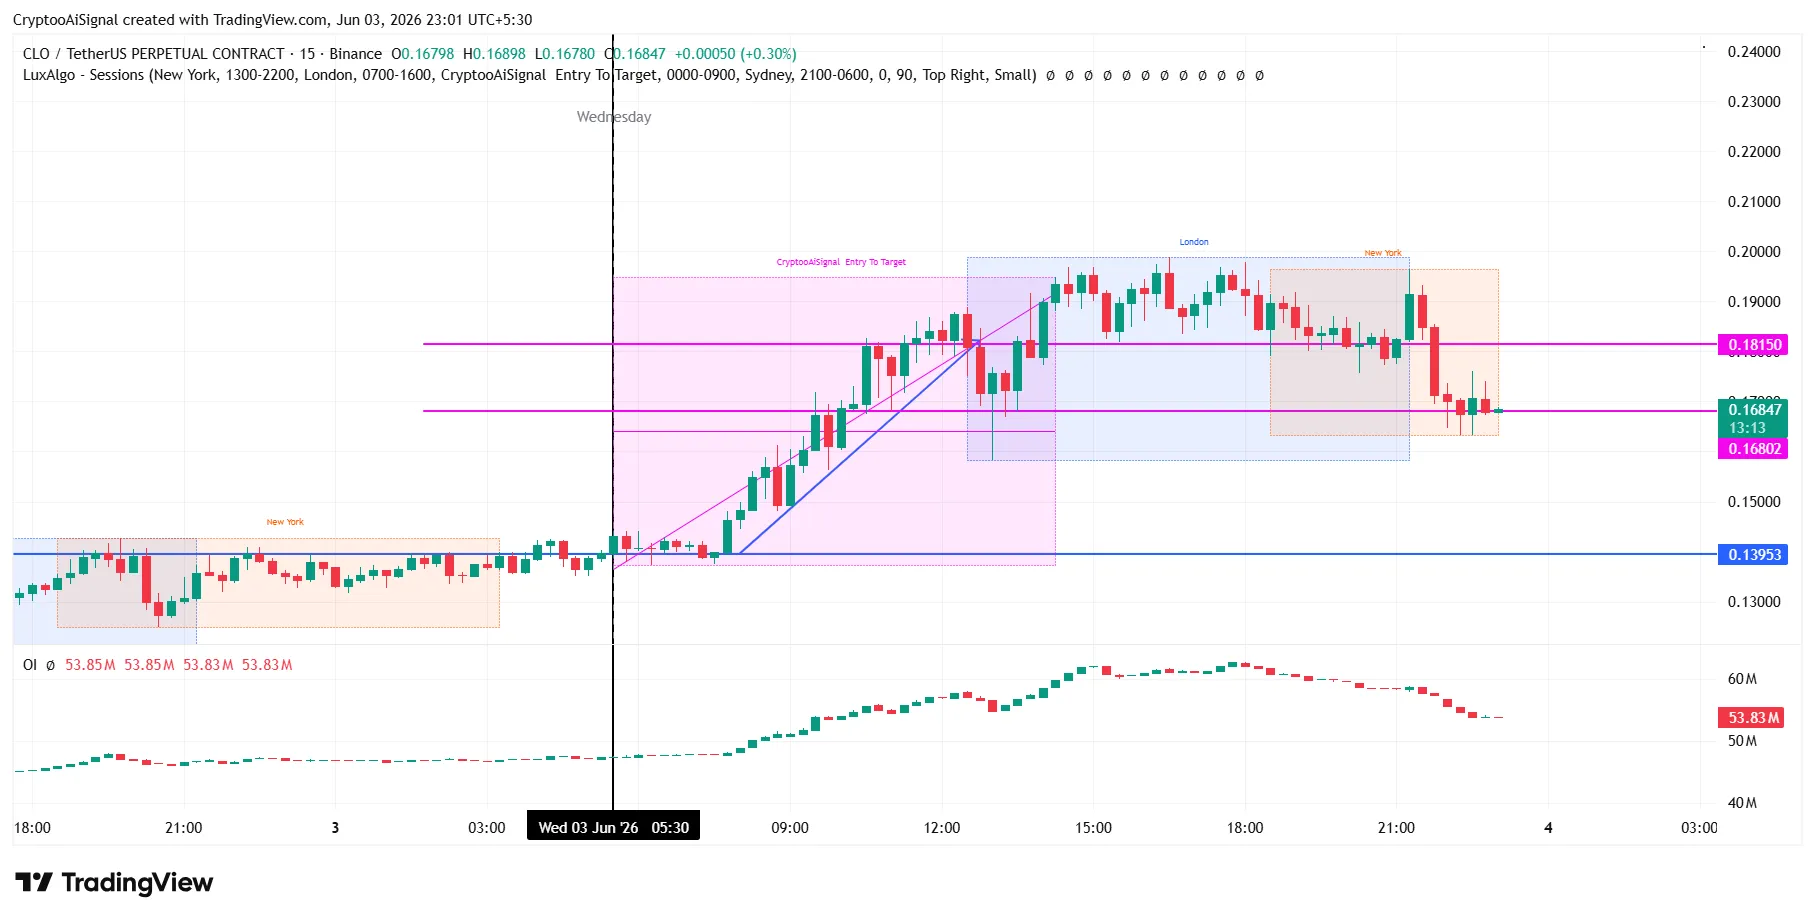
After the entry level, price broke out of the range and rose strongly. It passed the first target at 0.16802, then reached the second at 0.18150.
Price did not stop at the target. It pushed higher, into roughly the 0.19 to 0.20 area at its peak, before the move ran out of strength. Then it retraced. By the second chart, price had fallen back near 0.16847, close to the first target again.
This shows a key lesson. Strong moves often overextend and then pull back. Technical analysis helps you read the move and manage it, but it cannot call the exact top.
One more honest point. A target being reached on the chart is not the same as your profit. Your real result depends on your entry price, position size, leverage, fees, and when you exit. The chart shows a market event; your account shows a personal outcome.
Managing Risk on Perpetual Futures
This chart is a perpetual futures contract. Futures let traders use leverage to control a larger position with less money. Leverage can increase gains, but it also increases risk.
Here is the danger. After price reached the second target, it fell back sharply. A trader using high leverage could have been liquidated during that pullback, even though the chart still shows the targets being reached.
A stop loss is based on the asset price. It does not fully protect a leveraged position from liquidation, because margin and leverage can force a position to close earlier. In technical analysis, planning your risk is as important as reading the chart.
A Simple Technical Analysis Checklist
![IMAGE 3 [TA] CHART.png](/uploads/webp/863fb694ecf1ba17335f05f56b2e67b9.webp)
You can turn the steps above into a simple routine:
Set your timeframe.
Read the market structure: trending or ranging.
Mark support, resistance, and the range.
Check session timing for volume.
Watch for consolidation and a breakout.
Confirm with open interest and volume.
Plan your targets and your risk before you enter.
This routine works far beyond CLO/USDT. It is a repeatable way to read almost any crypto chart.
Frequently Asked Questions
What is technical analysis in crypto?
Technical analysis is the study of price and volume on a chart to understand market behaviour and plan trades. It works with probabilities, not guarantees.
Which timeframe is best for technical analysis?
There is no single best timeframe. Shorter timeframes suit intraday trading, and longer timeframes suit swing or position trading. Match the timeframe to your trading style.
What is a breakout?
A breakout is when price pushes out of a range or past a key level with force. A break above resistance can start a new upward move.
Does open interest predict price?
No. Open interest does not predict price on its own. It is a confirmation tool that shows whether new positions are entering or leaving the market.
Conclusion
Technical analysis is a step-by-step process, not a guess. You start with the timeframe, read the market structure, mark support and resistance, check the session timing, watch for a breakout, confirm with open interest, and plan your targets and risk.
The CLO/USDT chart showed each of these steps in action: a consolidation near the highs, a breakout, a strong trend, an overextended peak, and a retracement. Learn the process, apply it with discipline, and always plan your risk before you enter. That is how technical analysis is done.