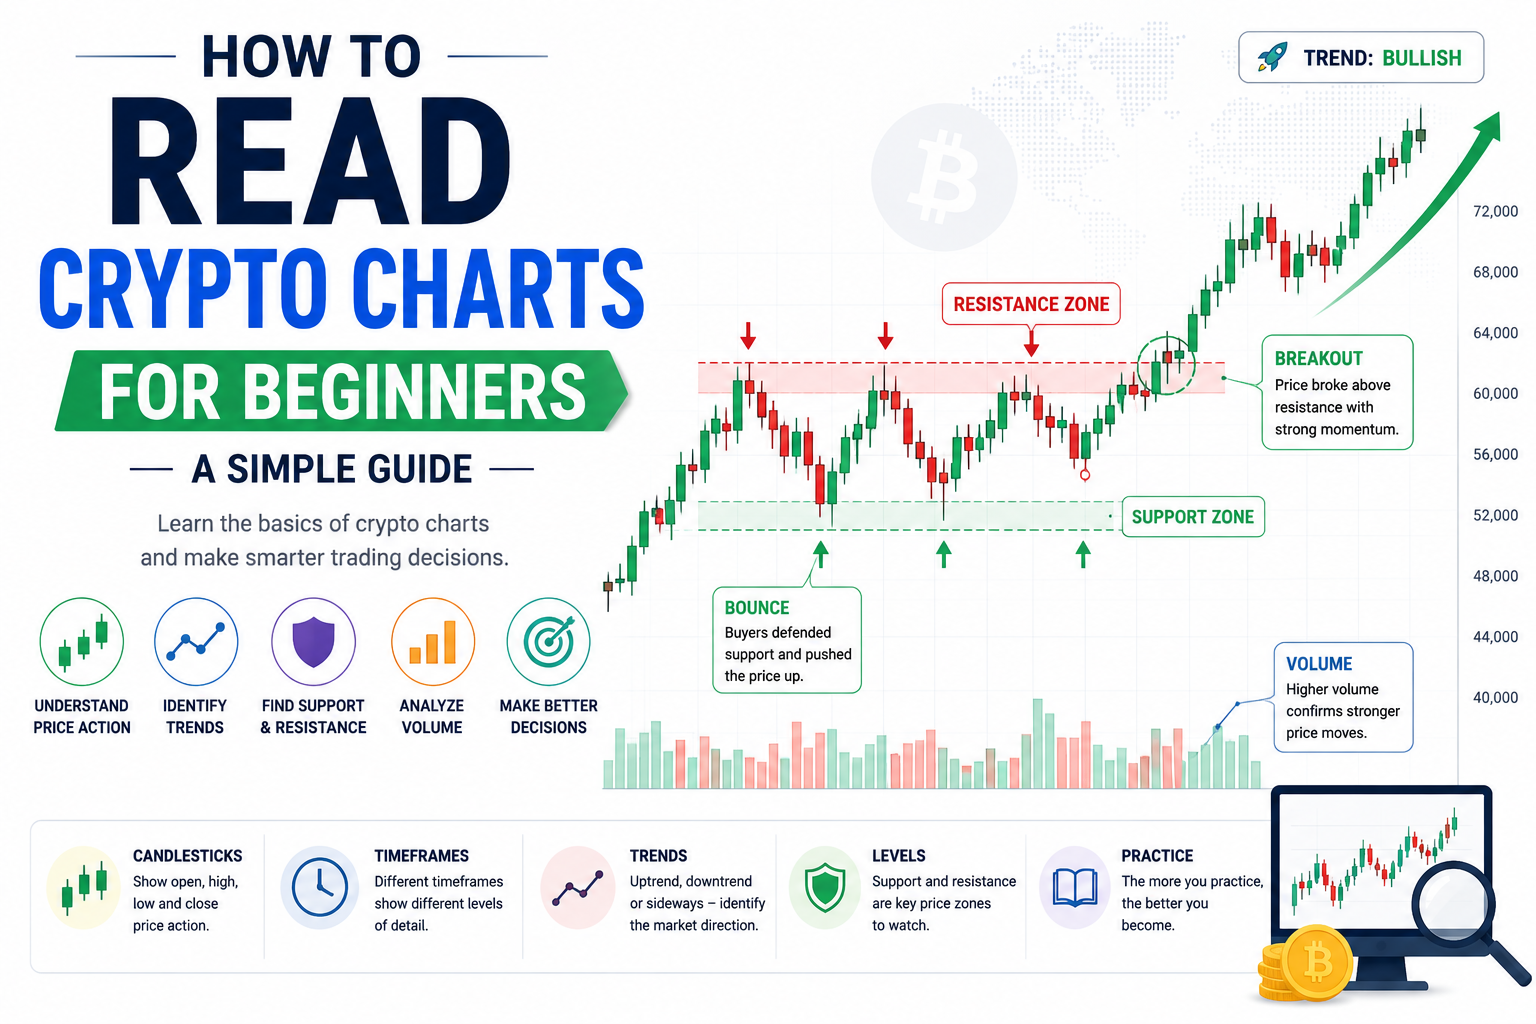
Why Reading Crypto Charts Matters
When you first open a crypto chart, it can look confusing. There are candles, colours, lines, and numbers everywhere. Many beginners feel lost and close the chart without understanding anything.
But a crypto chart is not complicated once you learn the basics. A chart is simply a picture of price over time. It shows how the price of a coin has moved in the past and how it is moving right now.
Learning to read charts helps you in three ways. First, you can see what the market is actually doing instead of guessing. Second, you can spot important price levels where buyers and sellers are active. Third, you can make more informed decisions instead of trading only on emotion or hype.
This guide explains the foundations in simple steps. You do not need any experience to follow it. By the end, you will be able to look at a basic crypto chart and understand the main things it is telling you.
What Is a Crypto Chart?
A crypto chart is a visual record of a coin's price. It plots price on one side and time on the other side. Each point on the chart shows the price at a specific moment.
Most crypto traders use a candlestick chart. This type of chart shows more information than a simple line. A single candlestick can tell you the opening price, the closing price, the highest price, and the lowest price for a chosen period of time.
Charts are available on almost every exchange and on free charting websites. The coin's price data is the same across platforms, so the skill you learn here works everywhere.
The Main Parts of a Crypto Chart
Before reading price action, you should understand the basic layout of a chart.
Price axis (vertical). This is on the right or left side. It shows the price levels. As you move up, the price is higher. As you move down, the price is lower.
Time axis (horizontal). This is along the bottom. It shows time moving from left to right. The far right is the most recent price. The far left is older price history.
Candles or bars. These sit in the middle and show price movement for each time period.
Volume bars. These usually appear at the bottom of the chart. They show how much of the coin was traded in each period.
Once you know where each part is, the chart stops feeling random and starts to make sense.
![IMAGE 1 [TA 1].png](/uploads/webp/d2726ac46025cae08d3125f44e4d5b30.webp)
Understanding Timeframes
Every chart uses a timeframe. The timeframe decides how much time each candle represents.
For example:
On a 1-minute chart, each candle shows one minute of price movement.
On a 1-hour chart, each candle shows one hour.
On a 1-day chart, each candle shows one full day.
Short timeframes, like 1 minute or 5 minutes, show fast movements and lots of small changes. They are used by very active traders. Longer timeframes, like the daily or weekly chart, show the bigger picture and the overall direction.
For beginners, longer timeframes are usually easier to read. They contain less noise and show clearer trends. A common habit is to check a higher timeframe first to understand the main direction, then move to a lower timeframe for detail.
How to Read a Candlestick
The candlestick is the heart of chart reading, so it is worth learning well.
Each candle has two parts:
The body. This is the thick part. It shows the opening price and the closing price for that period.
The wicks (also called shadows). These are the thin lines above and below the body. They show the highest and lowest price reached during that period.
Candles also use colour:
A bullish candle (often green) means the price closed higher than it opened. Buyers were stronger during that period.
A bearish candle (often red) means the price closed lower than it opened. Sellers were stronger during that period.
Here is a simple example. Imagine a 1-hour candle. It opens at 100 and closes at 105, and during that hour the price touched a high of 107 and a low of 99. This candle would be green (price went up), with a body from 100 to 105, a short upper wick reaching 107, and a lower wick reaching 99. (These numbers are only an example to explain the idea.)
Long bodies suggest strong movement in one direction. Long wicks suggest that price tried to move but was pushed back. Learning to read this "battle" between buyers and sellers is a key skill.
![IMAGE 2 [TA1].png](/uploads/webp/eaf79985e7c377ff19eed5e3aae1b740.webp)
Reading the Market Trend
A trend is the general direction of price over time. There are three main types.
Uptrend. The price makes higher highs and higher lows. Each time it rises, it reaches a higher peak, and each time it falls, it stays above the previous low. An uptrend shows that buyers are in control.
Downtrend. The price makes lower highs and lower lows. Each rise is weaker than the last, and each fall goes deeper. A downtrend shows that sellers are in control.
Sideways (range). The price moves within a flat zone, without a clear up or down direction. Neither buyers nor sellers are winning.
Reading the trend is one of the most useful skills for a beginner. Many traders follow a simple idea: it is usually safer to trade in the direction of the main trend rather than against it. Trends do not last forever, but understanding the current direction gives you important context.
![IMAGE 3 [TA1].png](/uploads/webp/33dfc52d7bdffe5101e4edb4e41433a3.webp)
Support and Resistance
Support and resistance are two of the most important ideas in chart reading.
Support is a price level where buying tends to appear and price often stops falling. Think of it as a floor. When price drops to this level, buyers step in and may push it back up.
Resistance is a price level where selling tends to appear and price often stops rising. Think of it as a ceiling. When price rises to this level, sellers step in and may push it back down.
These levels are not exact walls. They are zones where the market has reacted before. The more times price touches a level and reverses, the more traders pay attention to it.
Support and resistance help you in a practical way. They show you where price might slow down, bounce, or reverse. They also help you understand a breakout, which happens when price pushes through a level with strength and continues in that direction.
![IMAGE 4 [TA1].png](/uploads/webp/20d30dacf439aa2f4ef7bc9cb18c9732.webp)
What Volume Tells You
Volume shows how much of a coin was traded during a period. On most charts, it appears as bars at the bottom. A tall bar means high trading activity. A short bar means low activity.
Volume adds meaning to price movement. A price move with high volume is usually more reliable, because many traders are involved. A price move with very low volume can be weak and may not last.
For example, if price breaks above a resistance level with strong volume, the breakout is often taken more seriously. If it breaks above the same level with very low volume, traders may be more cautious, because fewer participants support the move.
Volume is not a magic tool, but it helps you judge whether a move has real strength behind it.
A Quick Look at Common Indicators
Once you are comfortable with candles, trend, support, resistance, and volume, you may start to explore indicators. An indicator is a tool that uses price and volume data to give you extra information.
Some common ones include:
Moving Average (MA): smooths out price to show the general direction over a period.
Relative Strength Index (RSI): helps show whether a coin may be overbought or oversold.
MACD: helps show momentum and possible changes in trend.
You do not need to master every indicator to read a chart. In fact, using too many at once often creates confusion. It is better to first understand raw price action, then add one or two indicators that you truly understand. Each of these tools deserves its own detailed study, and dedicated guides can help you learn them one at a time.
Common Beginner Mistakes
Many new traders make the same avoidable mistakes when reading charts.
Using too many indicators. A screen full of tools can hide the actual price action. Start simple.
Ignoring the higher timeframe. A move can look strong on a 5-minute chart but go against the main daily trend. Always check the bigger picture.
Forcing patterns. Beginners sometimes "see" a pattern that is not really there because they want a trade. Let the chart speak for itself.
Confusing prediction with probability. A chart does not tell you the future. It shows conditions and possibilities, not certainties.
Ignoring risk. Reading a chart is only one part of trading. Without risk management, even good chart reading can lead to large losses.
Avoiding these mistakes will make your chart reading far more reliable.
A Simple Step-by-Step Way to Read Any Chart
Here is a simple routine you can follow every time you open a chart.
Choose a higher timeframe first. Look at the daily or 4-hour chart to understand the main direction.
Identify the trend. Is price making higher highs, lower lows, or moving sideways?
Mark support and resistance. Find the key levels where price has reacted before.
Check the candles. Look at recent candles near those levels. Are buyers or sellers stronger?
Look at volume. Is the current move supported by strong activity or weak activity?
Then zoom in. If needed, move to a lower timeframe for detail, keeping the higher-timeframe direction in mind.
This simple order keeps you focused and stops you from getting lost in small movements.
Charts vs Trading Signals
It is helpful to understand the difference between reading a chart and using a trading signal, because they are not the same thing.
Reading a chart means looking at raw price data yourself. You study the candles, the trend, the levels, and the volume, and you form your own view. This is a skill you build over time.
A trading signal is a ready-made trade idea prepared through market analysis. A signal may include an entry price, target levels, and a stop-loss level. It saves you from doing all the analysis yourself, but you still need to understand what those levels mean.
The two work well together. Chart reading helps you understand why a level matters. A signal gives you a structured setup to evaluate. A trader who can read a chart is better able to judge a signal, verify it against the price action, and decide whether it fits their own plan and risk tolerance.
A signal is a decision-support tool, not a guaranteed prediction. No chart pattern and no signal can promise a result, because markets are always uncertain. This is why chart reading and risk management remain important even when you use signals.
Conclusion
Reading crypto charts is a skill, and like any skill, it becomes easier with practice. Start with the basics: understand the parts of a chart, learn how to read a candlestick, identify the trend, mark support and resistance, and check volume. These few tools already give you a strong foundation.
Do not rush to add complex indicators or advanced patterns. Master the simple things first, always check the higher timeframe, and never separate chart reading from risk management. Over time, what looked like a confusing screen of candles will start to tell you a clear story about what the market is doing.
Frequently Asked Questions
Which chart timeframe is best for beginners?
Longer timeframes, such as the daily or 4-hour chart, are usually easier for beginners. They contain less noise and show clearer trends than very short timeframes like 1 minute.
What is the difference between a green and a red candle?
A green (bullish) candle means price closed higher than it opened, so buyers were stronger in that period. A red (bearish) candle means price closed lower than it opened, so sellers were stronger.
Do I need indicators to read a crypto chart?
No. You can read a chart using only price action, trend, support and resistance, and volume. Indicators are optional tools you can add later, once you understand the basics.
Can chart reading predict the future price?
No. A chart shows past and current conditions and helps you judge probabilities. It cannot guarantee what price will do next, because markets are always uncertain.
Is reading a chart the same as following a signal?
No. Reading a chart means doing your own analysis of raw price data. A trading signal is a ready-made trade idea with defined levels. Chart reading skills help you understand and evaluate signals more effectively.